Natural disaster, safety failure and negligence – Lessons from big claims for all members

Risk Matters - Spring 2023

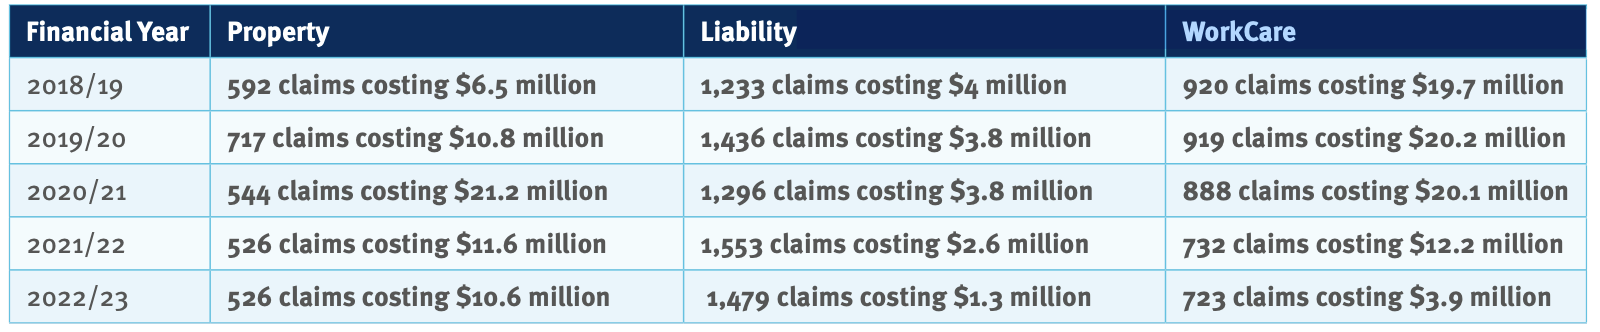
In 2022/23 LGIS received over 2,300 claims and paid out over $43.8 million. It’s a similar story most years with LGIS handling more than 2,000 claims across property, liability, workers’ compensation, motor and volunteer bushfire fighter protection.

The vast majority of claims are small to mid-sized in cost, but most years see a small number of extraordinary claims. The incidents that lead to these major claims can occur for a variety of reasons – natural disasters, safety failure or negligence.

There are lessons for all members from these major claims – not to say that they necessarily could’ve been avoided, but there are actions that could have been taken to reduce the severity of these losses (e.g. quantum, lost time and reputation).

Other sections in this season's Risk Matters

Aquatic Facility Equipotential Bonding

Western Australia is home to 129 public aquatic facilities and thousands more school, hotel/motel and back yard pools. While many know of the risks within these facilities such as lack of patron supervision, inappropriate use of shallow water and issues associated with slips, trips and falls – non-compliance with equipotential bonding (earthing) requirements can present a relatively unknown or hidden risk.

Read More »

Local governments working together

At its heart LGIS is local governments working together to protect their organisations, people and communities. The majority of claims are paid directly out of members’ contribution payments, which every year go into the ‘pot’ or ‘pooled fund’.

Large cost claims which exceed the pooled fund limit are paid by our indemnity partners (reinsurers). This year we invested $34.64 million (35% of contributions) to secure indemnity cover for the Scheme, ensuring that when disaster hits LGIS can respond quickly to support our members.

Take the most recent year, 2022/23 for example, LGIS collected $99.5 million in contributions and incurred claims costs totalling $56.43 million. Of that $56.43 million, we recovered $10.36 million from our indemnity partners. In other words, claims costs accounted for 56.7% of member contributions for 2022/23. Given the long-tail nature of worker’s compensation and liability, claims costs may develop even more as the 2022/23 year matures.

The flow of contributions in and claim payments out is not a simple equation, and LGIS makes sure that the retained fund meets minimum capital requirements as well as the claims and reinsurance expenses. We also earn income from investments which supports part of the day-to-day operational costs to manage and deliver the Scheme.

It’s an approach that has worked for over 25 years, making LGIS one of the longest running local government mutuals in Australia.

This mix of a pooled fund, under pinned by indemnity providers, works and allows LGIS to be nimble and responsive to our member needs.

Mutual benefits when mitigating risks

It’s clear when looking at the relationship between contributions and claims paid, how all members benefit from consistent risk management across the entire sector. Consistent and effective risk management across the sector, reduces the number of incidents that cause claims and eases pressure on contributions.

LGIS is committed to working with our members to build capacity and capability to manage risks and drive down claims – protecting the Scheme, containing contribution costs, and ensuring the sustainable protection of the WA local government sector.

What’s happening with sector claims?

The Scheme continues to experience expenditure pressure; particularly from the WorkCare and Property portfolios with poor results over the last three years.

WorkCare claims numbers are decreasing, but the average cost of claims has gone up to $27,570, which is a 46% increase in the last five years. Over that time, lost time injury (LTI) days have also increased by 40%. Moreover, over 60% of claimants were aged over 50 in the last five years; many of these claims have arisen due to aggravation of pre-existing injuries or a reduction in physical capacity.

Psychological injuries, which are on average 45% more expensive per claim than musculoskeletal injuries, are also on the rise.

The Property program is also experiencing increases with the 10-year average cost per claim increasing by 15% in the 2022/23 period – faster than inflation.

The majority of LGIS Liability claims continue to be driven by damage and/or injury caused by trees and managed road networks. Since 2008, there has been a steady upwards trend.

Figure 1: Property and liability claims

Have a question you'd like answered?

Each month we take your questions to one of our LGIS team members to answer.

If you want to submit a question for next issue, email us at [email protected]

Share on Twitter
Share on LinkedIn

Other sections of this season's Risk Matters

CEO’s Message – Spring 23

The first quarter of 2023/24 has been a busy one for your Scheme; our member services team has been out on the road visiting members, and I’ve enjoyed the opportunity to continue to meet members and discuss the issues that matter to you.

Read more »